Do You Even Need a Demand Forecast?

Here is a question I keep coming back to since building the online Beer Game.
In the game, a team that simply passes each order straight upstream spends about $1,100 over 36 weeks. A typical human team spends about $3,300. Doing nothing clever wins by two thirds.
So if you have a sensible safety stock policy, and you just make what customers order as they order it, do you need a demand forecast at all?
It is a fair question, and the honest answer is: for some products, not much of one. For others, you cannot run without it. To find out where the line sits, I ran five ordering policies through the same Beer Game engine and compared what happened.
The setup
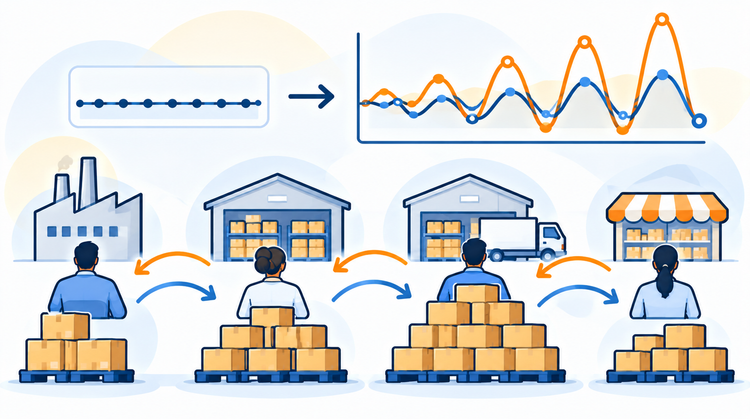
The game is the classic MIT version. Four tiers: retailer, wholesaler, distributor and factory. Orders take two weeks to reach your supplier, and cases take two more weeks to arrive. Holding a case costs $0.50 a week and owing a customer a case costs $1.00 a week.
Consumer demand changes once. It goes from 4 cases a week to 8 in week 5, and stays there. If you have not played it, try it first, then come back. The results land harder once you have created a bullwhip yourself.
For the policies that use a stock target, every tier aims to hold five weeks of average demand (the four-week lead time plus a week of cover) plus 4 cases of safety stock. Each tier also counts what is already on order, which is the step most human players skip.
The results
| Ordering policy | Team cost | Biggest factory order | Customers fully served at the end? |
|---|---|---|---|
| Typical human team | $3,295 | 37 | No |
| Pass-through: order what you receive | $1,112 | 8 | No. The retailer is still 16 cases short |
| Stock target from a 4-week average of the orders you receive | $5,358 | 130 | Yes |
| Stock target from a 13-week average of the orders you receive | $2,260 | 23 | Yes |
| Stock target from a 4-week average of real consumer demand | $1,037 | 18 | Yes |
Each row tells a different story, so it is worth going through them.
Pass-through looks great until you check the shelf
Pass-through never creates a bullwhip. The factory's biggest order is 8, exactly what consumers buy. It is the cheapest policy apart from the last one.
But look at where it finishes. After 36 weeks, every tier is still in backorder. The retailer owes customers 16 cases, the wholesaler 12, the distributor 8 and the factory 4. In a real business, that is a permanent stock-out that turns into lost sales.
The reason is simple. Demand doubled while stock was still in transit, so each tier fell behind. A rule that only ever orders what it just received has no way of catching up. It keeps the chain calm, but it never rebuilds the buffer for the new level of demand.
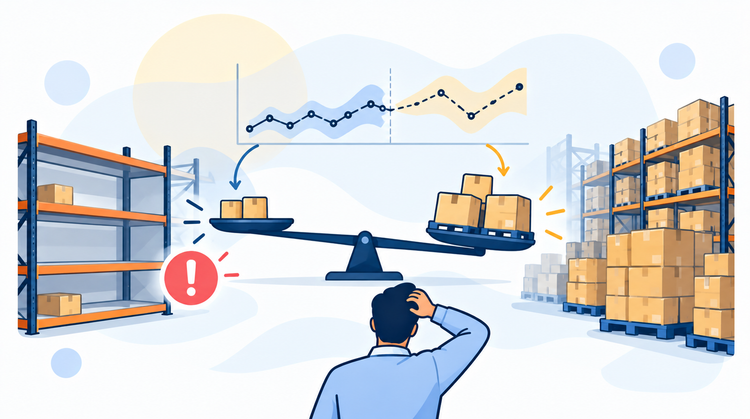
That is where the safety stock policy comes in. Someone has to decide that the buffer should now be sized for 8 cases a week, not 4. And that decision is a forecast.
Safety stock already contains a forecast
This is the part that often gets missed. A reorder point is expected demand over the lead time, plus safety stock. Safety stock itself is sized from how much demand is expected to vary.
So "the right safety stock policy" is not an alternative to a forecast. It has one built in. It might be a simple rolling average, but it is still a view of future demand, and it goes stale when demand moves.
The common FMCG approach is to make the buffer dynamic: hold a set number of weeks of cover, based on the average of the last few weeks of sales. When demand moves, the buffer moves with it. That is a good instinct. The next two rows show how it can go wrong.
Moving the buffer creates its own bullwhip
When a tier sees demand rise, it orders the new demand plus extra stock to lift its buffer. So its supplier sees a jump bigger than the real change. If the supplier also sets its buffer from the average of the orders it receives, it amplifies that jump again.
With a 4-week average, this gets ugly fast. The factory's biggest order hits 130 cases, against real demand of 8. The team spends $5,358, more than a typical human team. A short average reacts quickly, but it passes on every wobble, and every tier adds its own.
A 13-week average is much calmer. The factory peaks at 23, cost drops to $2,260, and every tier ends up fully stocked. It is better than a typical human team and it fixes pass-through's shortfall. But the whip is still there, growing at each step: the biggest orders go 10, 13, 17 and 23 up the chain. A long average is smoother, but slow to catch up.
This is the trade-off every planner who sets cover targets lives with. Fast enough to keep up with demand, slow enough not to chase noise.
The fix is which demand you average
The last row changes one thing. Every tier still uses a 4-week average, but it averages real consumer demand instead of the orders arriving from its customer.
The difference is dramatic. Cost drops to $1,037, the cheapest of any policy, and below pass-through. The factory peaks at 18 cases. And every tier finishes fully stocked.
The averaging method is the same. Only the input changed. When the wholesaler, distributor and factory can see what consumers actually bought, there is nothing to amplify. Each tier resizes its buffer once, to the real new level, and settles.
This is the business case for sharing point-of-sale or customer withdrawal data. It is not a nice-to-have for collaboration meetings. In this test, it is the difference between a $5,358 chain and a $1,037 chain using the same formula.
So when do you need a real forecast?
A rolling average is a forecast, just the simplest one. It is always looking backwards. For some products, that is all you need. For others, it will always be late.
Where a simple average can do the job
- Stable, high-volume lines with no strong seasonality
- Replenishment lead times shorter than the time your customer will wait
- Flexible capacity, small minimum order quantities and decent shelf life
- Access to true downstream demand, not just the orders you receive
For these lines, pulling stock to actual consumption often beats a detailed forecast. Forecasts carry error, and pushing that error straight into orders adds noise.
Where you need a forward-looking forecast
Anywhere a decision has to be made before the demand shows up:
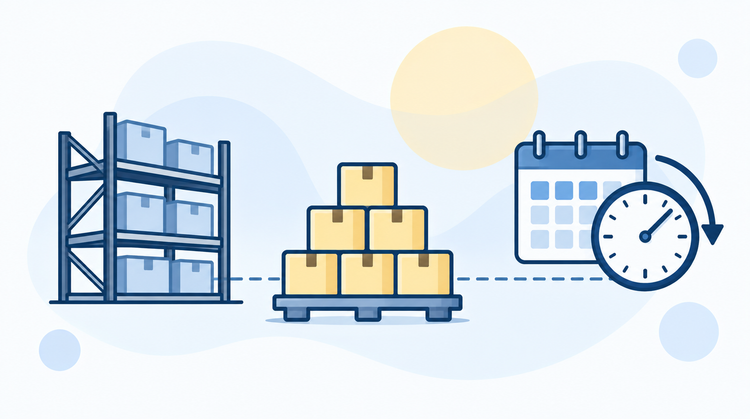
- Long lead times. Raw materials, packaging and imported ingredients often have to be ordered months before the sale.
- Capacity. Labour rosters, extra shifts and production campaigns all need a view of the weeks ahead.
- Seasonality. A rolling average is always low going into the peak and high coming out of it. I showed this with real numbers in building a seasonal forecast in Excel.
- Promotions. The spike is planned. Waiting for it to show up in the average means running out during the promotion and holding stock afterwards.
- New products and range changes. There is no history to average.
- Short shelf life. You cannot hold a buffer big enough to cover the uncertainty without writing stock off.
- The business plan. S&OP, budgets, supplier contracts and cash flow all need a forward view.
Forecast to set the policy, let demand drive the orders
The forecast does not go away. Its job changes.
Instead of using the forecast to decide what to order every week, use it to set the things that need a forward view: buffer sizes, capacity, long-lead purchases, and the point at which a policy needs resetting. Then let real demand trigger the weekly orders against those settings.
Most bullwhip comes from doing the opposite. Each tier forecasts from the distorted orders below it and pushes that forecast straight into its own orders. Researchers Lee, Padmanabhan and Whang named this "demand signal processing" in their well-known 1997 paper on the bullwhip effect.
Four things to check in your own business
- What demand are your cover targets based on? If it is the orders you receive rather than your customer's sales or withdrawals, you may be amplifying their noise.
- How long is your averaging window, and why? If nobody can explain why it is 4 weeks or 13, it was probably set once and never tested.
- How fast do buffer changes flow into orders? Lifting a target in one jump creates a spike for your supplier. Phasing it in over a few weeks is gentler on everyone.
- Which of your lines actually need a detailed forecast? Sort your range by lead time, seasonality and promotional activity. The stable, short-lead-time lines may need far less forecasting effort than they get. The seasonal, promoted and long-lead lines probably need more.
A note on the numbers
These results come from the Beer Game, which is a deliberately simple chain: one product, fixed lead times, unlimited capacity and a single change in demand. Real networks are messier. The absolute dollar figures will not transfer to your business. The patterns do, and I have seen each of them in real FMCG supply chains.
If you want to see the bullwhip from the inside, play the Beer Game and try running your seat with a cover target. Then read why the bullwhip happens for the three habits that stop it.
Try it on your numbers: See which of your items are steady enough to plan simply, and which need real forecasting with the free ABC-XYZ analysis tool.


Member discussion